
Map-based visualisation is one of the key data visualisation tools in epidemiology (see World Health Organisation’s Cancer Today for main data visualisation tools for cancer prevalence analysis).
The most common map-based visualisation are dot maps (where dots are used over a map to represent certain feature, e.g. disease cases), choropleth maps (where individual level data is aggregated for a specified area, and graded colours or shades to indicate the values of aggregated values per area) and heat maps (where individual or aggregate level data is used to derive a spatial gradient).
This blog post reports the latest developments carried out in the MIDAS project context, regarding the extension of the choropleth map visualisation used by an earlier investigation by Austin Tanney from Analytics Engines, permitting the geospatial analysis at different scales(i.e. municipality, administrative region, health service provision region or province level).
The prototypes have been developed using government open data from Open Data Euskadi. In the first prototype, two scales (province and township level) of cycle lane density (number of kilometres per 10.000 people) can be visualised in an interactive choropleth type visualisation.
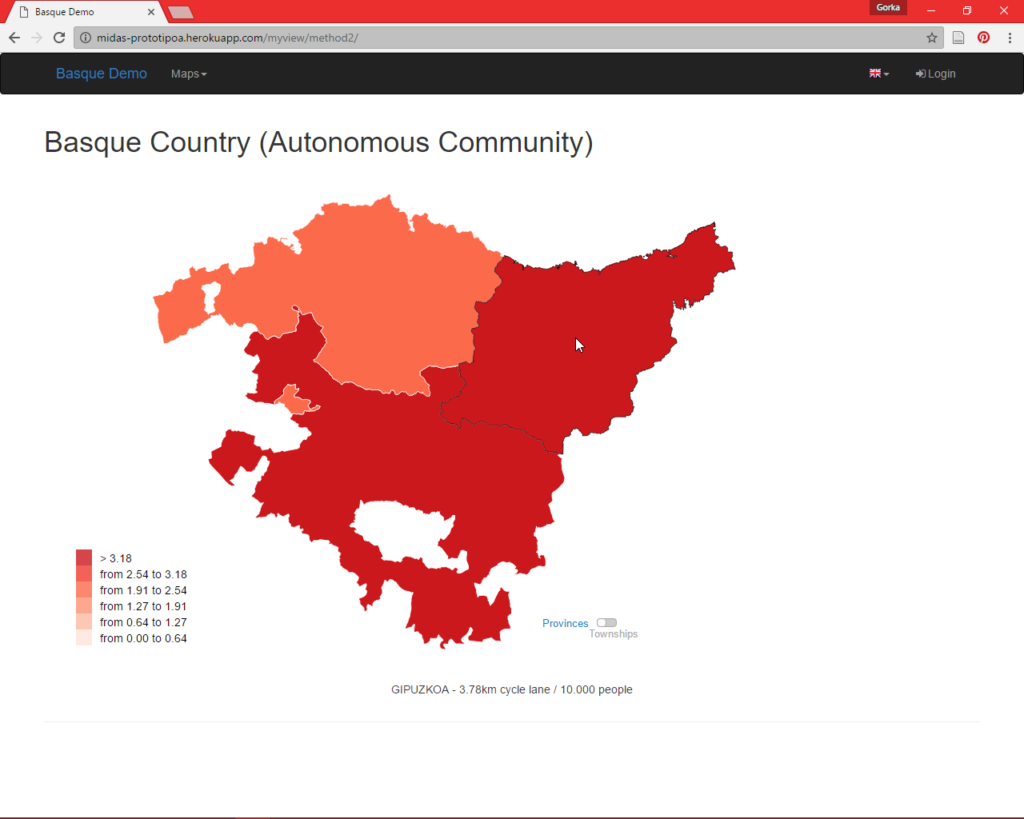
Figure 1: First Prototype – Province Level
As result of the first prototype-supported discussions, a second prototype has been developed. In this second prototype a three-level geographical aggregation (province, region and township level) and year-based aggregation is proposed to visualise and analyse body mass index (BMI) evolution at different geographical granularity in time.
Prototypes have had good acceptance among the epidemiologists. Nevertheless, as a matter or refinement, they have pointed out the need to include rate adjustments per genre and age ranges, and to facilitate getting insights of the dynamics through time (e.g. Gapminder). Work is now focused on improving upon the previous prototypes on these aspects.
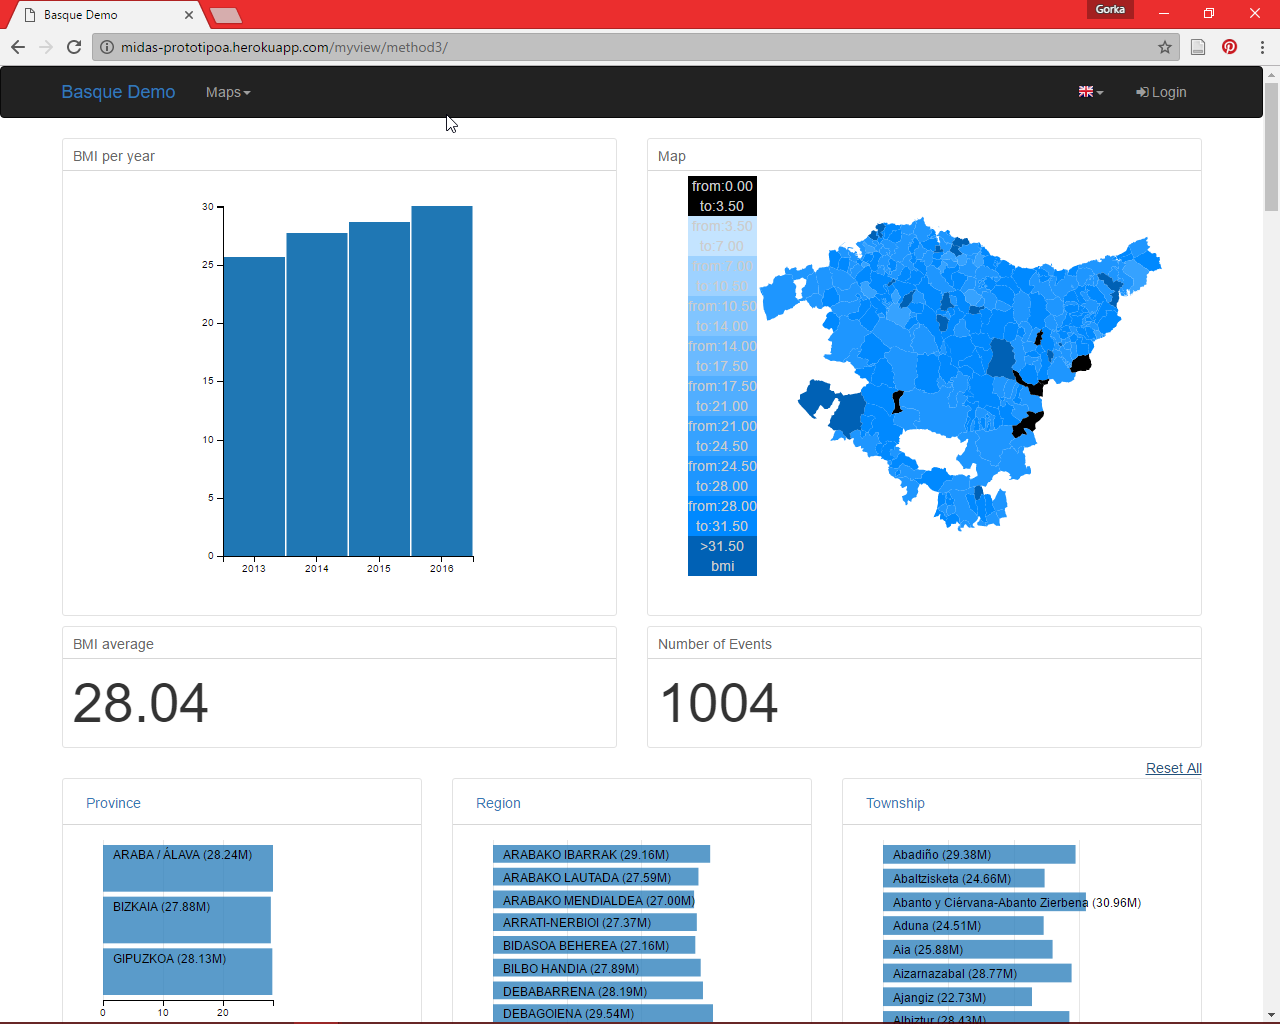
Figure 2: Second Prototype – All Selected
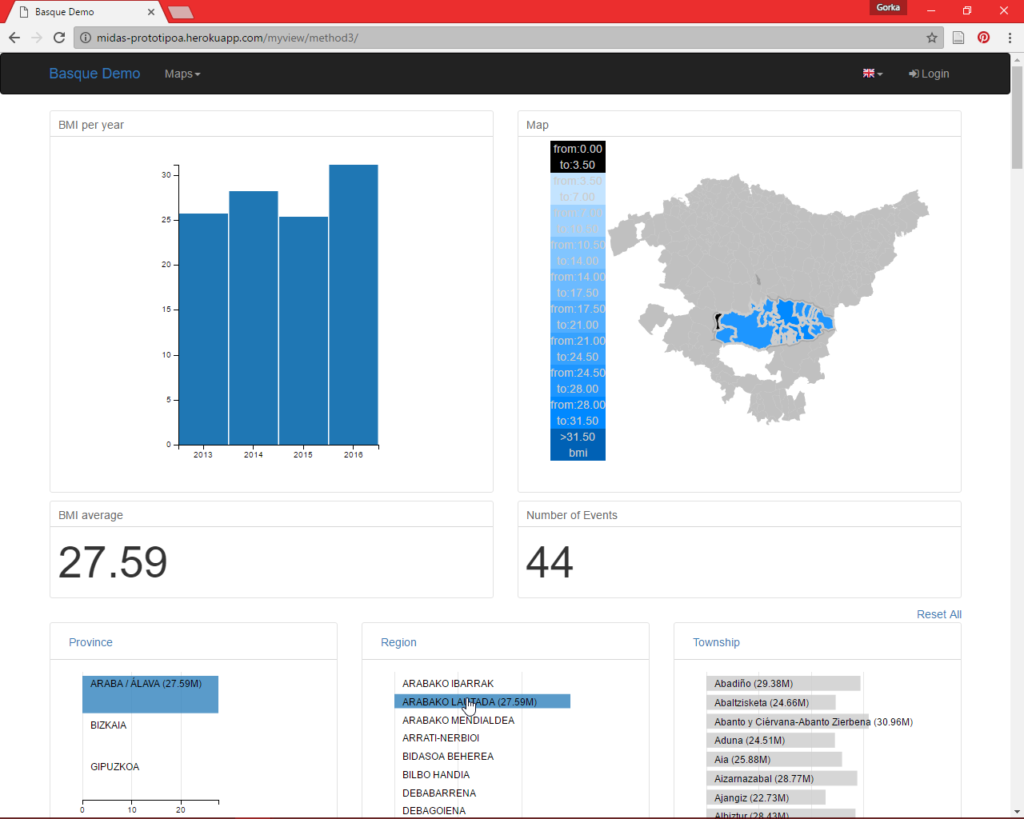
Figure 3: Second Prototype – Region Selected