
Guest post by Dr Gorka Epelde from Vicomtech
Within a data-driven decision-making context it is key to guarantee the quality of the data upon which decisions are made. In the MIDAS project framework, data quality assurance is required to make the right health-related policy decisions. Quality of the data needs to be monitored and guaranteed in all the steps starting from source data loading, to pre-processing, analytics execution and down to the final data contained in the visualizations used for decision-making.
In this post, we focus on reporting the activities and developments in the context of data source loading and pre-processing. In the Big Data environment of MIDAS this relates to analysing the correctness of the heterogeneous sets of data to be loaded for analysis.
As a starting point, we have drafted a dataset description procedure with the purpose of homogenising the way in which datasets provided by healthcare institutions and other data sources (such as governmental open data) are described for non-specialists. Besides homogenising datasets descriptions, the goal is to provide enough information for a data researcher to interpret the results of each dataset’s profiling (provided by data harmonisation tools) and to perform harmonisation interventions specifically tailored to the dataset. Next, our dataset description procedure is summarised:
- First a general description of the dataset is provided as well as its context, structure and include any generally observed issue, especially regarding the quality of data. Then, each file composing the dataset is described, including the way in which it is related to the rest (e.g. which is the common identifier variable(s)/field(s) used to link data among files)
- For each file, in case of having any other level of data, such as for spreadsheets (e.g. Microsoft Excel), a description of the lower level structure, sheets in the spreadsheet, a description and way to link to the rest of the data needs to be included.
- If the quality of data differs for a particular level (i.e. file, sheet), it should be indicated including the specific issues.
- Finally, each variable is described regarding its content, including the data type (e.g. integer, boolean, date). When sensible, additional information about the variable should be provided (e.g. format, coding standard, pre-processing).
In parallel to the dataset description procedure definition and implementation with different datasets, we have been analysing the state of art of data harmonisation tools and developing the data harmonisation tool that would fit best into MIDAS project needs. In the MIDAS project for its first implementation iteration we have focused on tabular data given that for this iteration prioritised data sources mainly include anonymised data from EHRs and governmental open data mostly in tabular format for processing.
Within the state of art of open or web-available tabular data harmonisation tools, identified most relevant tools include pandas-profiling and CSV engine. These toolsets produce nice and interesting profiling results, but they’re quite limited when it comes to acting over the initial raw data. Using these toolsets as inspiring starting point, we’re working on implementing functionalities for cleaning, missing values imputation, identifying and fixing out layers, and identifying highly correlated variables to limit the number of variables for the analysis phase.
The harmonisation tool is being implemented with a clear separation between the functionalities (logic) and the user interface (GUI), so that though initially a web interface is being developed, later other interfaces such as a console interface for expert users can be implemented easily.
Next, the development status of the harmonisation tool is described through the description of its web interfaces.
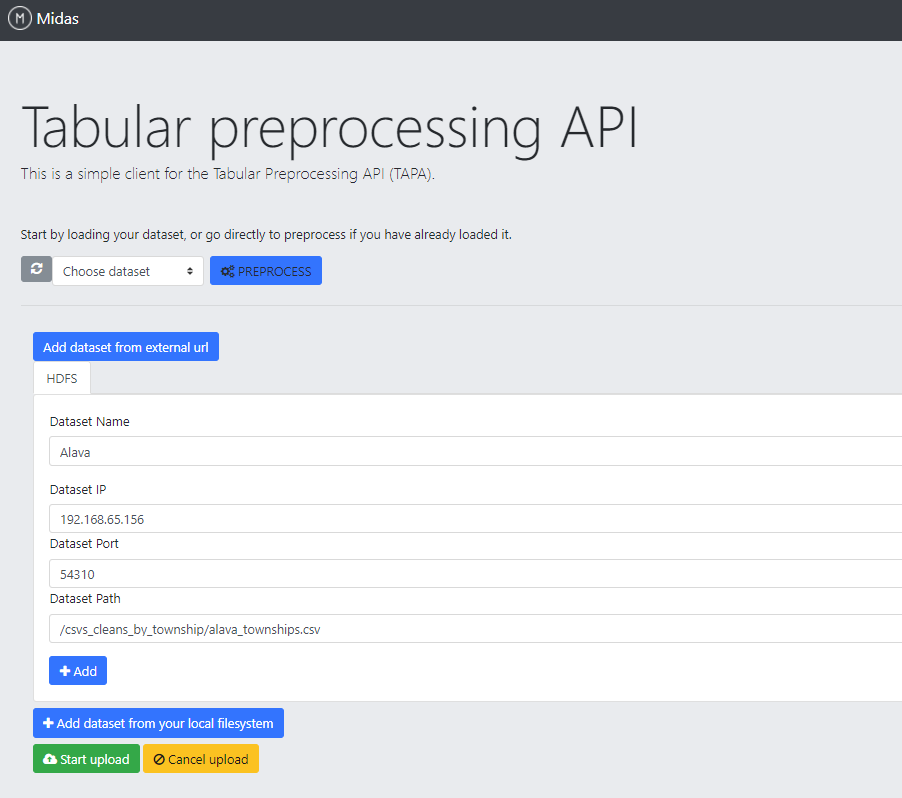
Tabular data loading
The tool allows users to load tabular data (csv files) stored both in your local filesystem or in a HDFS (Hadoop Distributed File System) cluster.
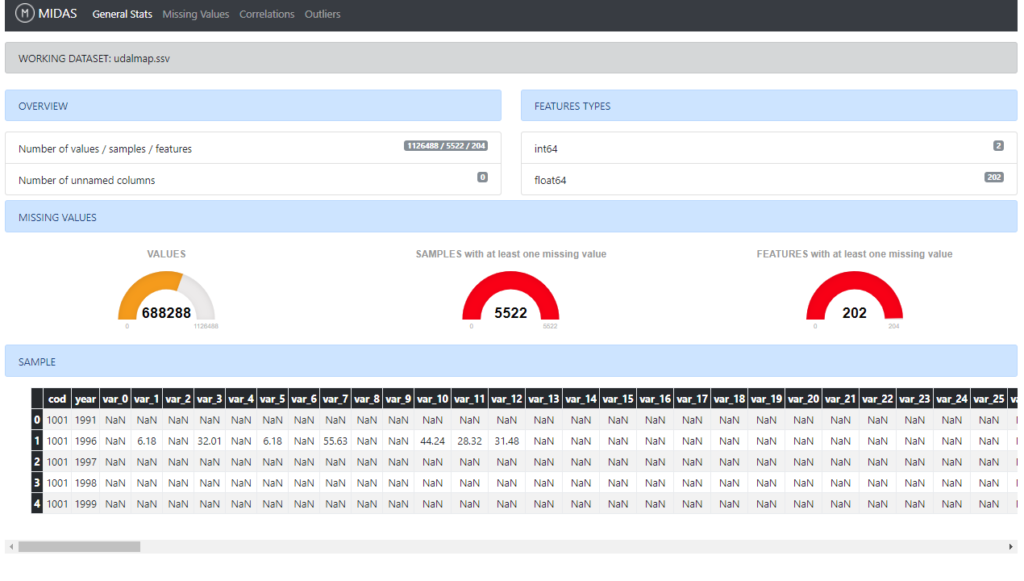
General Stats
A general overview is presented in this section, allowing users to have an initial perception of the dataset status. The main depicted characteristics are: total number of values, samples and features, inferred types of the features and amount of missing data per values, samples, and features. Finally, a sample of the dataset is shown as a reference.
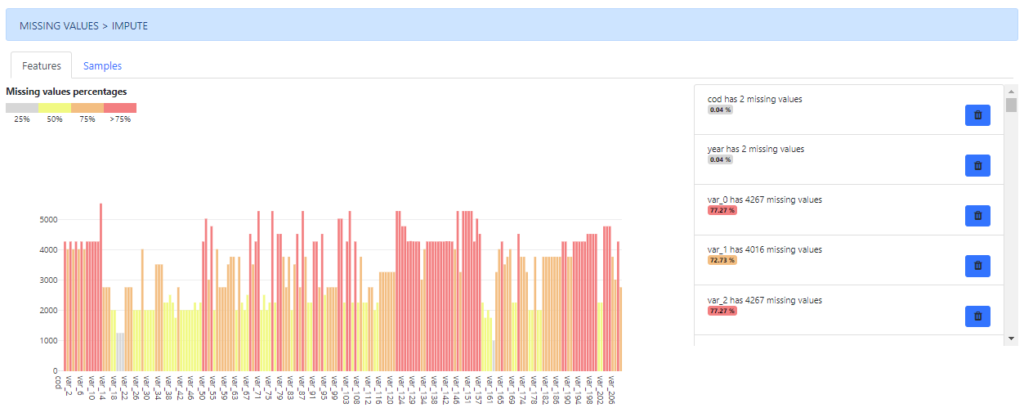
Missing Values
The presence of missing data is quite common within datasets and they usually have a significant effect on the conclusions that can be drawn from the data. This section provides users with a set of tools and visualizations to deal with missing values.
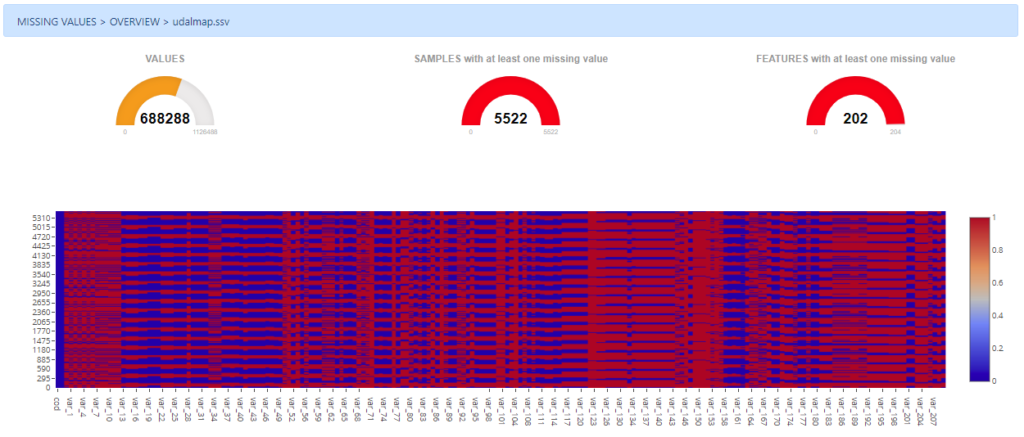
Firstly, an overview of the amount of missing data per values, samples and features is depicted. Additionally, a heatmap is also drawn to help users in the identification of patterns related to missing values.
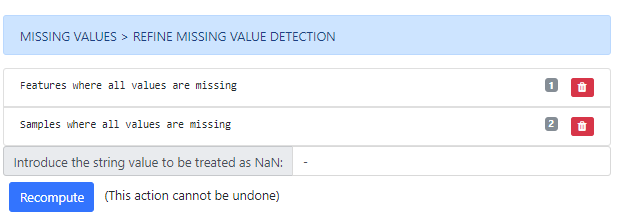
Secondly, a tool to refine the missing values detection is presented to the user. This tool allows users to detect and drop samples and features which all their values are missing. Additionally, it is possible to add extra character patterns to be considered as missing values and checking for these new patterns on the dataset dynamically.
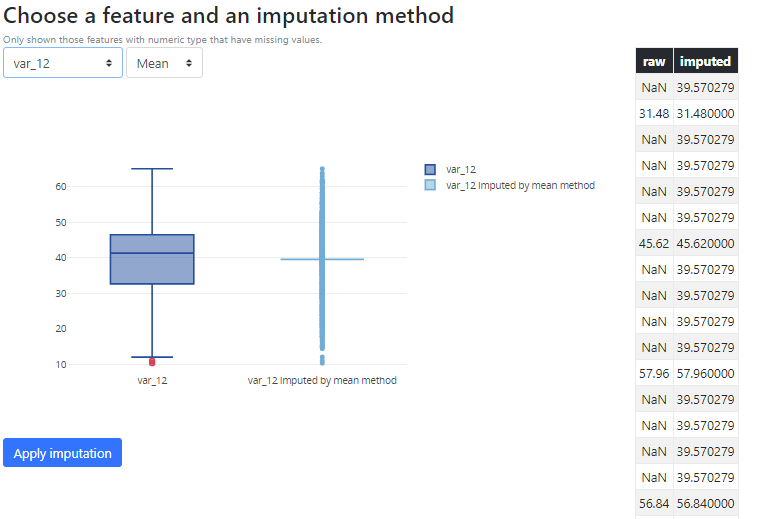
Thirdly, a section has been developed to allow users to analyse visually the dataset in terms of missing values, by features and samples.
In both cases there are methods available to impute and/or remove these missing values.
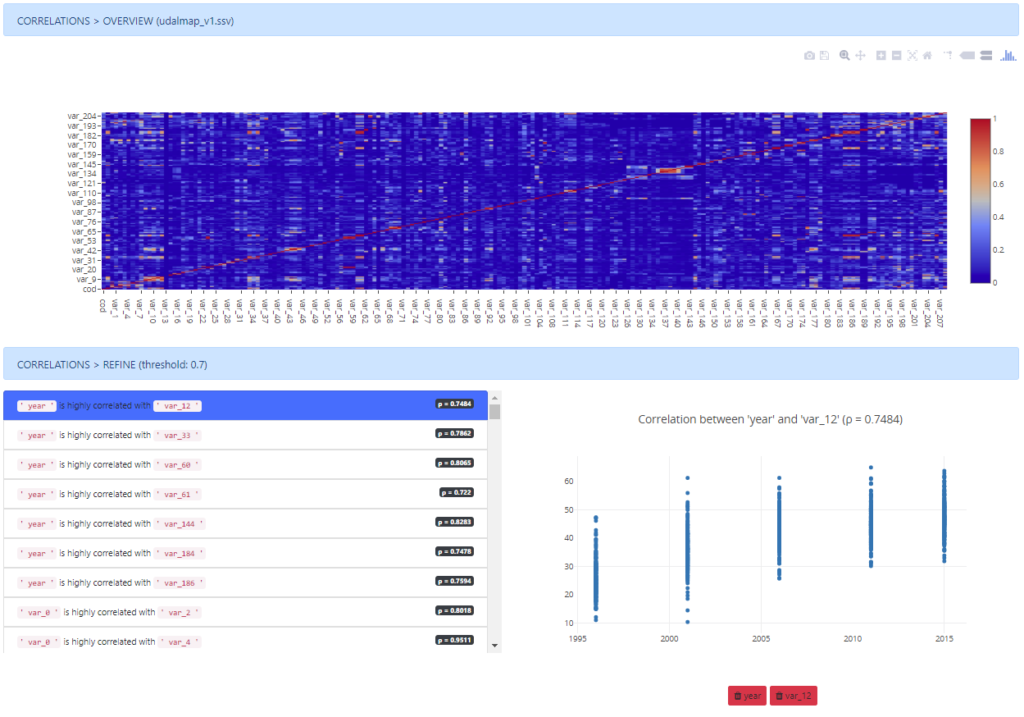
Correlations among variables
As a first step in dimensionality reduction, a section has been developed to detect correlations among variables using a visual representation of the correlation matrix. All the features with a p-value higher than a certain threshold are highlighted and enabled to be deleted.
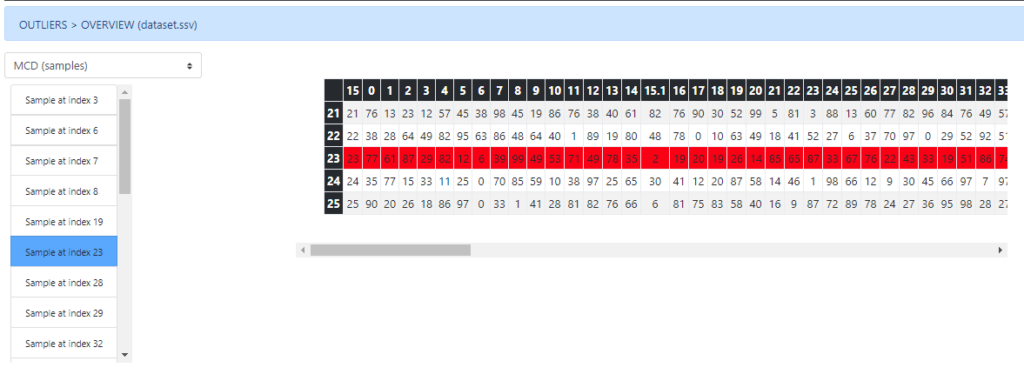
Outlier detection
Two methods have been implemented to detect outliers within the dataset. The first one (Tukey) works at feature level, considering only the values from each feature individually to detect the outliers.
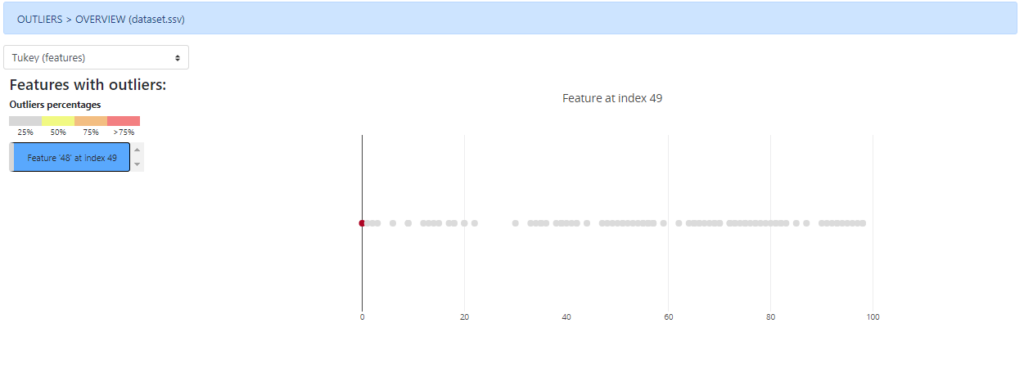
The second one, works at sample level, having into account all the dataset values to highlight those samples candidates to be considered as outliers.
Future work of the harmonisation tool with regards to new functionality will be focussed on metadata export including quality information (containing the operations done from original dataset as well as quality metrics), extension to other data types required in MIDAS and the adjusting the actual developments to MIDAS real and larger data.
Demo
Data harmonization initial developments available at:
http://tapa-data-harmonization.herokuapp.com/
Sample file to upload and play with: