
A guest post by J. Pita Costa, L. Stopar, F. Fuart from Quintelligence
The growing challenges and opportunities of Public Health institutions in the era of Big Data reveal needs and problems to address in order to improve efficiency and profit of the available (often real-time) knowledge. In that, the open data has a highlighted role due to its easy access and potential to complement other proprietary data sources. MIDAS enables the integration of heterogeneous data sources, provides privacy-preserving analytics, forecasting tools and visualisation modules of actionable information (see the dashboard of the first prototype in Figure 1). The integration of open data is fundamental to the participatory nature of the project and core ideology, that heterogeneity brings insight and value to analysis. This will democratize, to some extent, the contribution to the results of MIDAS. Moreover, it enables the MIDAS user to profit from the often powerful information that exists in these open datasets.
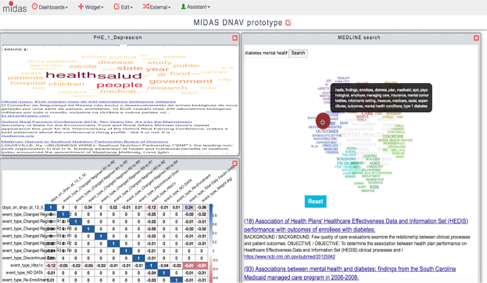
Figure 1. MIDAS platform dashboard, composed of visualisation modules customized to the public health data sourced in each governamental institution, complemented with the open data from worldwide news and from the MEDLINE biomedical knowledge-base.
This pipeline of tools proposed by MIDAS focus two large open datasets – Worldwide News and MEDLINE – providing integrated solutions that can be easily customized to the needs of the users. The workflow considers three types of users with different levels of expertise and availability, mirroring the real needs of the target institutions. These are: (a) the decision-maker, (b) the data scientist and (c) the IT responsible. The availability of (a) is usually scarce, and this user is interested in having monitoring tools in sync with the defined priorities, enabling evidence-based policy-making. While (c) has usually more IT expertise than (b), its availability is more scarce (and, usually, also the staff size in this position), and thus the technical independence of the (b) users is valuable.
The proposed pipeline of tools is addressing the above concerns, making available: (i) a dedicated dashboard with overall functionality and several visualization modules; (ii) a public version of it that is easily sharable by URL over, e.g. iframe; and (iii) a custom widget integrated in the main MIDAS dashboard. Moreover, it permit the users to: (i) further improve the informative significance of their own proprietary data; (ii) to explore aspects of it in a global/local context, based on the new layers of information that can be accessed to; and (iii) to have better informed decision-making based on evidence sourced in trustful knowledge-bases.
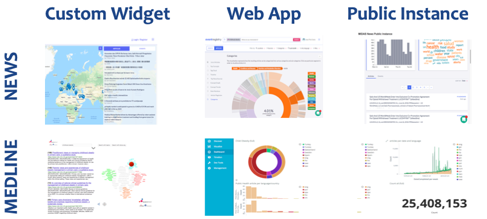
Figure 2: The overall pipeline of tools covering the open data sources of worldwide news and MEDLINE, including for each of these datasets a visualization widget integrated in the main platform, a data exploration web application, and a public instance that serves as a monitoring dashboard for decision-makers.
This technology makes use of semantic web tools extracting information from two large open datasets: the worldwide news, throughout 60+ languages; and the biomedical research knowledge base MEDLINE, where annotated information over 26+ million articles is made available. It also permits the integration of the insights from both of these datasets to enable a smart monitoring system that is complemented by the proprietary data of the Public Health institute. The described technologies are based on well-established tools, some of them already in the market. A selection of these can also be deployed in the context of proprietary data, and are served with APIs to smoothly integrated the user’s own technological systems.
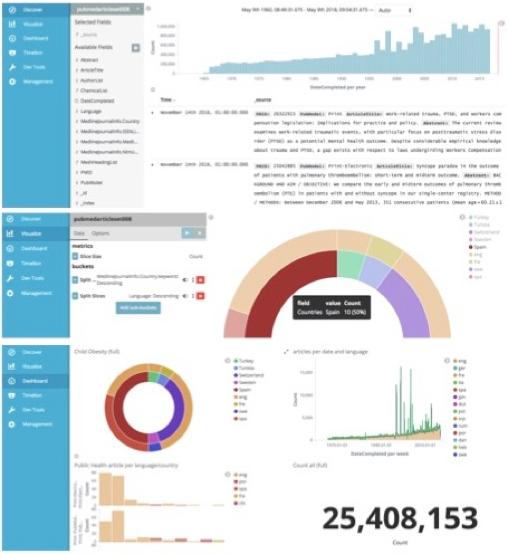
Figure 3. MEDLINE data visualisation tool enabling exploration of that open dataset in its full potential, based on data representations easy to understand and to communicate. It provides an interactive public instance that can be managed at the dashboard management tool (below) for which the visualisation modules are constructed (in the center) based on the queries made to the MEDLINE dataset (above).
The manipulation and visualization of such a complete data source such as MIDAS brings challenges, particularly in the efficient search, review and presentation of the appropriate scientific knowledge. One of the identified needs motivating this work is assuring the availability of a dynamic dashboard that permits the user to explore data visualisation modules, representing the queries to the MEDLINE dataset through pie charts, bar charts, etc. The dashboard that we made available (in Figure 3) feeds on that dataset through the elasticSearch index. It is composed of several interactive visualisation modules that utilises the mouse hover when interacting and provide information through mouse-over messages on several aspects of the data based on particular queries of interest (e.g. a pie chart representing the “public health” citations that talk about “childhood obesity” during a selected period of time; or a bar chart showing different concepts included in the articles related to “mental health” in Finnish scientific journals).
This dedicated MEDLINE dashboard, as conceptualised at MIDAS and implemented in the MIDAS platform, serves the less technical user to explore the data available (over a subset of the data generated by a topic of interest), other options are available that permit more control of the data by the data scientists at a more operational level. These are: (i) the management dashboard, where the technical user can perform the appropriate subsampling based on the topics of interest and the optional advanced options over the available data features; (ii) the visual modules creator permitting the less technical user to easily create new interactive visualisation modules; and (iii) the live dashboard, that can be set up through iframe as a live window of the decision-maker’s workflow, enabling to monitor the status of the KPIs represented at each visualisation module.